Multiple Choice
The figures below show Chris's consumption of specialty coffee per week. 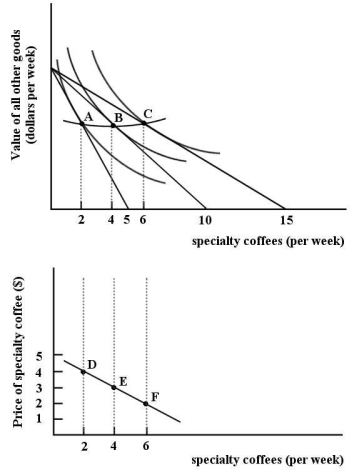 FIGURE 6-10
-Refer to Figure 6-10.The two diagrams in Figure 6-10 are showing
A) the change in Chris's preferences toward specialty coffee.
B) that Chris is indifferent between bundles A,B and C.
C) the derivation of Chris's demand curve for specialty coffee.
D) that Chris is indifferent between points D,E and F.
E) the derivation of Chris's indifference curve for specialty coffee.
Correct Answer:

Verified
Correct Answer:
Verified
Q38: The paradox in "the paradox of value"
Q39: <img src="https://d2lvgg3v3hfg70.cloudfront.net/TB5441/.jpg" alt=" FIGURE 6-5 -Refer
Q40: The diagram below shows a set of
Q41: The marginal rate of substitution<br>A)always has a
Q42: Bjorn is a student with a monthly
Q44: A demand curve for a normal good
Q45: The table below shows the total value
Q46: When a consumer's marginal rate of substitution
Q47: The table below shows the total value
Q48: <img src="https://d2lvgg3v3hfg70.cloudfront.net/TB5441/.jpg" alt=" FIGURE 6-6 -Refer