Multiple Choice
6A-5 Income and Substitution Effects 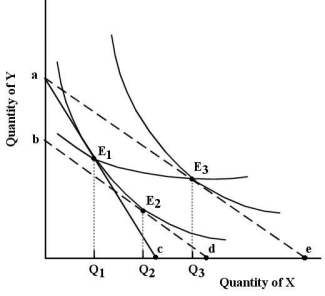 FIGURE 6-11
-Refer to Figure 6-11.Suppose the consumer begins at E1.The income and substitution effects of the reduction in the price of X are represented as follows:
A) the distance Q1d shows the substitution effect and the distance Q2e shows the income effect.
B) the distance de shows the income effect and the distance cd shows the substitution effect.
C) the distance Q1Q2 shows the income effect and the distance Q2Q3 shows the substitution effect.
D) the distance Q1Q2 shows the substitution effect and the distance Q2Q3 shows the income effect.
E) the distance Q1Q3 shows the substitution effect and the distance Q2Q3 shows the income effect.
Correct Answer:

Verified
Correct Answer:
Verified
Q48: <img src="https://d2lvgg3v3hfg70.cloudfront.net/TB5441/.jpg" alt=" FIGURE 6-6 -Refer
Q49: The table below shows the total value
Q50: In which of the following situations will
Q51: If money income is reduced by half,and
Q52: 6A-4 Deriving the Demand Curve<br>-Refer to Figure
Q54: If all consumers in an economy have
Q55: Given a particular market demand curve,consumer surplus
Q56: Assume you are consuming two goods,X and
Q57: <img src="https://d2lvgg3v3hfg70.cloudfront.net/TB5441/.jpg" alt=" FIGURE 6-2 -Refer
Q58: <img src="https://d2lvgg3v3hfg70.cloudfront.net/TB5441/.jpg" alt=" FIGURE 6-2 -Refer