Multiple Choice
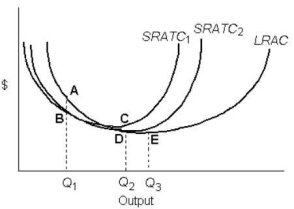 FIGURE 8-2
-Refer to Figure 8-2.Decreasing returns to scale occur over the output range
A) 0 to Q1 only.
B) Q1 to Q2 only.
C) Q2 to Q3 only.
D) 0 to Q3 only.
E) beyond Q3 only.
Correct Answer:

Verified
Correct Answer:
Verified
Related Questions
Q61: A short-run average total cost curve will
Q62: Movement from one point to another along
Q63: Suppose a firm employs two inputs,X and
Q64: Suppose a firm is using 1500 units
Q65: Suppose that capital costs $6 per unit
Q67: What information is displayed by an isoquant?<br>A)the
Q68: A firm operates at its least-cost position
Q69: Consider a firm that uses only labour
Q70: The figure below shows a family of
Q71: Movement from one point to another along