Multiple Choice
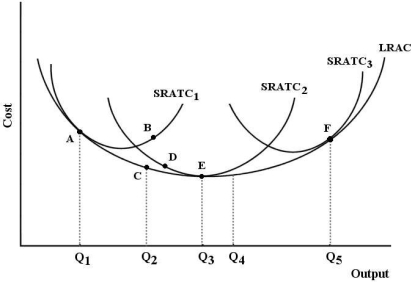
The figure below shows a family of cost curves for a firm.The subscripts 1,2,and 3 for the SRATC curves refer to different plant sizes.  FIGURE 8-3
-Refer to Figure 8-3.What is the difference between the SRATC curves and the LRAC curve?
A) The SRATC curves show the optimal plant size when all factors of production are variable,whereas the LRAC shows the lowest cost attainable associated with each LRAC curve.
B) The SRATC curves show the lowest attainable cost of production at each level of output when all factors are variable in the short run,whereas the LRAC curve shows the same in the long run.
C) The LRAC is an envelope curve,joining the minimum points on all SRATC curves.
D) For the SRATC curves,one or more of the factors of production is fixed,whereas for the LRAC curve,all factors of production are variable.
E) The SRATC curves show diseconomies of scales,whereas the LRAC curve shows economies of scale.
Correct Answer:

Verified
Correct Answer:
Verified
Q36: <img src="https://d2lvgg3v3hfg70.cloudfront.net/TB5441/.jpg" alt=" FIGURE 8-4 -Refer
Q37: Suppose RioTintoAlcan is considering the construction of
Q38: <img src="https://d2lvgg3v3hfg70.cloudfront.net/TB5441/.jpg" alt=" FIGURE 8-4 -Refer
Q39: <img src="https://d2lvgg3v3hfg70.cloudfront.net/TB5441/.jpg" alt=" FIGURE 8-1 -Refer
Q40: Suppose a firm is using 100 units
Q42: The slope of an isoquant measures<br>A)the marginal
Q43: Suppose a firm is using 100 units
Q44: <img src="https://d2lvgg3v3hfg70.cloudfront.net/TB5441/.jpg" alt=" FIGURE 8-1 -Refer
Q45: Suppose that capital costs $8 per unit
Q46: For many firms the LRAC curve is