Multiple Choice
The figure below shows a family of cost curves for a firm.The subscripts 1,2,and 3 for the SRATC curves refer to different plant sizes. 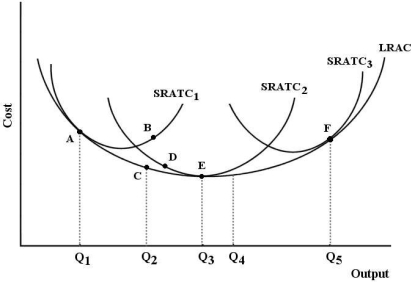 FIGURE 8-3
-Refer to Figure 8-3.Each of the three SRATC curves shows
A) technically inefficient methods of production,given that they lie above the LRAC.
B) the lowest cost attainable,given that the plant size is the largest it can possibly be.
C) the output that is possible when all factors of production are fixed.
D) the lowest cost attainable,holding the plant size constant.
E) optimal plant sizes in the long run.
Correct Answer:

Verified
Correct Answer:
Verified
Q122: A change in the technique for producing
Q123: Refer to Figure 8-6.Suppose this firm is
Q124: Suppose capital costs $280 per unit and
Q125: Suppose Farmer Smith hires 4 workers and
Q126: <img src="https://d2lvgg3v3hfg70.cloudfront.net/TB5441/.jpg" alt=" FIGURE 8-4 -Refer
Q128: Suppose RioTintoAlcan is considering the construction of
Q129: Canada has a much lower population density
Q130: The figure below shows the isocost lines
Q131: Suppose a firm experiences decreasing returns to
Q132: Suppose that capital costs $50 per unit