Multiple Choice
The figure below shows a family of cost curves for a firm.The subscripts 1,2,and 3 for the SRATC curves refer to different plant sizes. 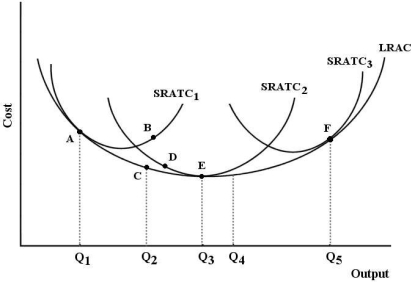 FIGURE 8-3
-Refer to Figure 8-3.The minimum efficient scale is achieved by this firm at output level
A) Q1.
B) Q2.
C) Q3.
D) Q4.
E) Q5.
Correct Answer:

Verified
Correct Answer:
Verified
Q131: Suppose a firm experiences decreasing returns to
Q132: Suppose that capital costs $50 per unit
Q133: Suppose capital costs $2000 per unit and
Q134: The following table shows the marginal products
Q135: A short-run average total cost curve and
Q136: <img src="https://d2lvgg3v3hfg70.cloudfront.net/TB5441/.jpg" alt=" FIGURE 8-1 -Refer
Q137: By expressing the cost-minimizing condition as MP<sub>K</sub>/MP<sub>L</sub>
Q138: When a firm seeks to minimize costs
Q139: Suppose a firm is employing labour (L)and
Q141: The following table shows the marginal products