Multiple Choice
The figure below shows a family of cost curves for a firm.The subscripts 1,2,and 3 for the SRATC curves refer to different plant sizes. 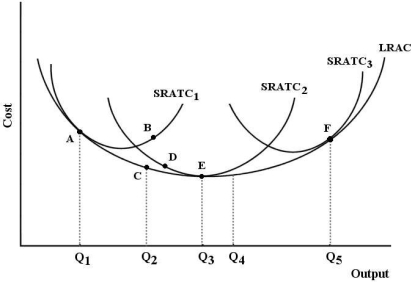 FIGURE 8-3
-Refer to Figure 8-3.If this firm is producing at point B,then
A) this firm is producing a level of output that is technically inefficient in the long run.
B) this firm is experiencing decreasing returns to scale.
C) this firm could produce the same level of output at a lower cost with plant size 2.
D) it should employ more of its variable factors of production.
E) plant size 1 is optimal.
Correct Answer:

Verified
Correct Answer:
Verified
Q30: Consider the short-run and long-run cost curves
Q31: Suppose that capital costs $100 per unit
Q32: The creation of a new product is
Q33: Although capital is a variable factor in
Q34: When a cost-minimizing firm is faced with
Q36: <img src="https://d2lvgg3v3hfg70.cloudfront.net/TB5441/.jpg" alt=" FIGURE 8-4 -Refer
Q37: Suppose RioTintoAlcan is considering the construction of
Q38: <img src="https://d2lvgg3v3hfg70.cloudfront.net/TB5441/.jpg" alt=" FIGURE 8-4 -Refer
Q39: <img src="https://d2lvgg3v3hfg70.cloudfront.net/TB5441/.jpg" alt=" FIGURE 8-1 -Refer
Q40: Suppose a firm is using 100 units