Multiple Choice
The figure below shows a family of cost curves for a firm.The subscripts 1,2,and 3 for the SRATC curves refer to different plant sizes. 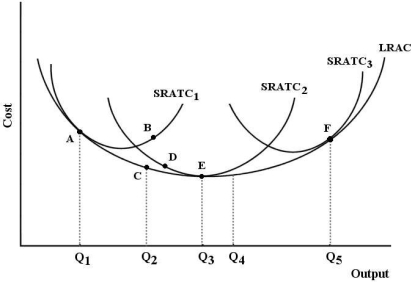 FIGURE 8-3
-Refer to Figure 8-3.Suppose this firm is producing output level Q3 with plant size 2.Now suppose this firm changes to plant size 3 and is producing output level Q5.We can say that
A) the firm is then operating with the optimal plant size.
B) this firm has experienced economies of scale.
C) output has increased more than in proportion to the increase in inputs.
D) output has increased exactly in proportion to the increase in inputs.
E) output has increased less than in proportion to the increase in inputs.
Correct Answer:

Verified
Correct Answer:
Verified
Q88: Which of the following conditions indicate cost
Q89: Refer to Figure 8-6.Suppose the firm is
Q90: With respect to innovation,which of the following
Q91: Which of the following paired concepts are
Q92: Of the following,which is the least likely
Q94: Refer to Figure 8-6.Suppose there is a
Q95: A firm's least-cost position for producing a
Q96: In recent years,garbage collection has changed dramatically.Twenty-five
Q97: Suppose a firm moves from one isoquant
Q98: Which of the following statements concerning long-run