Multiple Choice
Consider the following cost curves for Firm X,a perfectly competitive firm. 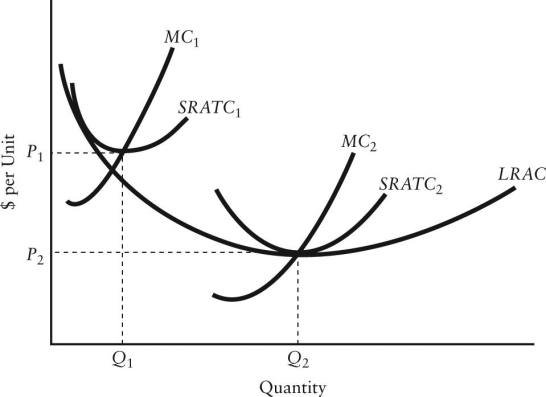 FIGURE 9-5
-Refer to Figure 9-5.At output Q2 and price P2,which of the following is FALSE?
A) There are economic profits to attract new entrants.
B) The firm producing Q2 is at its long-run profit-maximizing position.
C) P = MC = SRATC = LRAC.
D) There are no unexploited internal economies of scale.
E) Firm X is producing at its minimum efficient scale.
Correct Answer:

Verified
Correct Answer:
Verified
Q140: <img src="https://d2lvgg3v3hfg70.cloudfront.net/TB5441/.jpg" alt=" FIGURE 9-1 -Refer
Q141: The theory of perfect competition is built
Q142: Consider the total cost and revenue curves
Q143: Consider the following cost curves for Firm
Q144: Suppose your trucking firm in a perfectly
Q146: Consider the price and quantity data below
Q147: If a firm in a perfectly competitive
Q148: A firm in a perfectly competitive industry
Q149: Average revenue (AR)for an individual firm in
Q150: Under perfect competition,the demand curve facing an