Multiple Choice
The diagram below shows the short-run cost curves for 3 perfectly competitive firms in the same industry. 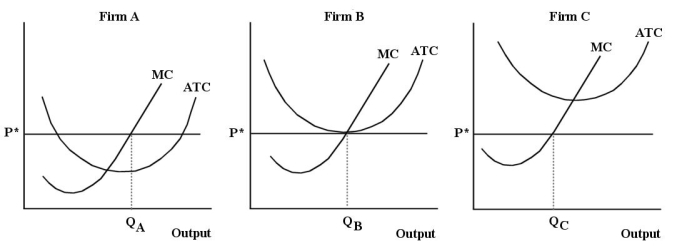 FIGURE 9-6
-Refer to Figure 9-6.Given that Firms A,B and C are in the same industry,is this industry in long-run equilibrium?
A) No,because Firm A is not producing at a profit-maximizing level of output.
B) No,because if the industry were in equilibrium,all 3 firms would be earning zero economic profits.
C) Yes,because all 3 firms are producing at their minimum average total cost.
D) Yes,because P = MC = MR for each of the 3 firms.
E) Yes,because each of the 3 firms is operating at its minimum efficient scale.
Correct Answer:

Verified
Correct Answer:
Verified
Q79: If firms in a competitive industry are
Q80: Consider the total cost and revenue curves
Q81: Consider the following short-run cost curves for
Q82: On a graph showing a firm's TC
Q83: Consider the price and quantity data below
Q85: <img src="https://d2lvgg3v3hfg70.cloudfront.net/TB5441/.jpg" alt=" FIGURE 9-1 -Refer
Q86: Which of the following statements does NOT
Q87: <img src="https://d2lvgg3v3hfg70.cloudfront.net/TB5441/.jpg" alt=" FIGURE 9-1 -Refer
Q88: <img src="https://d2lvgg3v3hfg70.cloudfront.net/TB5441/.jpg" alt=" FIGURE 9-1 -Refer
Q89: The perfectly elastic demand curve faced by