Multiple Choice
The diagram below shows the short-run cost curves for 3 perfectly competitive firms in the same industry. 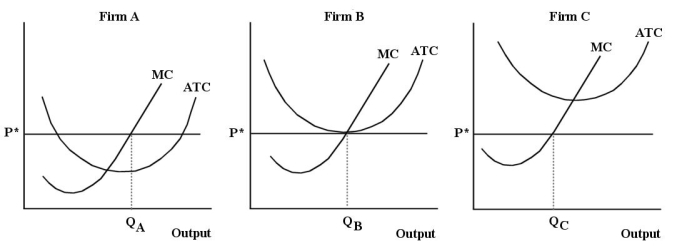 FIGURE 9-6
-Refer to Figure 9-6.Which firm or firms is likely to exit this industry?
A) Firm A
B) Firm B
C) Firm C
D) all of Firms A,B,and C
E) none of Firms A,B,and C
Correct Answer:

Verified
Correct Answer:
Verified
Q110: For a given market price,a perfectly competitive
Q111: Suppose ABC Corp.is a firm producing newsprint
Q112: In the long run it is not
Q113: Any firm's average revenue is defined as<br>A)total
Q114: A perfectly competitive firm's total revenue is
Q116: The conditions for a perfectly competitive market
Q117: Consider the following short-run cost curves for
Q118: When economists say that a firm is
Q119: Suppose XYZ Corp.is a profit-maximizing firm that
Q120: The supply curve for a perfectly competitive