Multiple Choice
The diagram below shows the short-run cost curves for 3 perfectly competitive firms in the same industry. 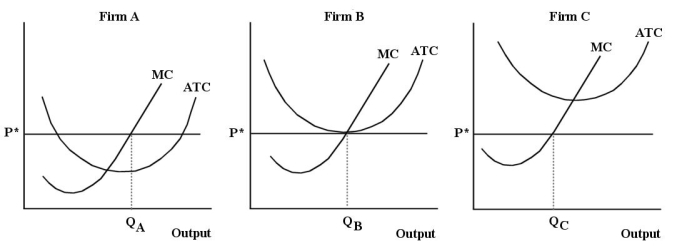 FIGURE 9-6
-Refer to Figure 9-6.Which of the following statements about Firms A,B and C is true?
A) Firm A is suffering losses,Firm B is breaking even,and Firm C is earning profits.
B) Firm A is breaking even,Firm B is suffering losses,and Firm C is earning profits.
C) Firm A is earning profits,Firm B is breaking even,and Firm C is suffering losses.
D) Firms A,B and C are breaking even.
E) Firms A,B and C are earning profits.
Correct Answer:

Verified
Correct Answer:
Verified
Q45: Firms have several different concepts of revenue:
Q46: If a perfectly competitive firm in the
Q47: Which of the following statements about a
Q48: Suppose a typical firm in a competitive
Q49: Consider a perfectly competitive firm that is
Q51: 9.3 Short-Run Decisions<br>Assume the following total cost
Q52: Consider the price and quantity data below
Q53: <img src="https://d2lvgg3v3hfg70.cloudfront.net/TB5441/.jpg" alt=" FIGURE 9-1 -Refer
Q54: <img src="https://d2lvgg3v3hfg70.cloudfront.net/TB5441/.jpg" alt=" FIGURE 9-1 -Refer
Q55: If the demand curve faced by a