Multiple Choice
The figure below shows the demand schedule and demand curve for a product produced by a single-price monopolist. 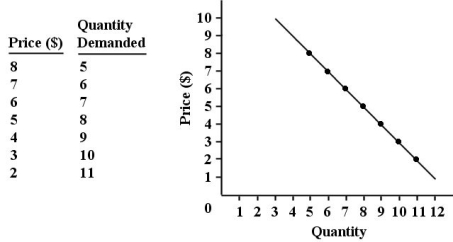 FIGURE 10-1
-Refer to Figure 10-1.What is the level of output at which marginal revenue first becomes negative?
A) 5th unit
B) 6th unit
C) 7th unit
D) 8th unit
E) 9th unit
Correct Answer:

Verified
Correct Answer:
Verified
Q3: Suppose that a single-price monopolist knows the
Q4: Suppose the technology of production is such
Q5: The average revenue curve for a single-price
Q6: Consider a monopolist that is able to
Q7: A monopolist will be earning positive economic
Q9: A monopoly is distinguished from a firm
Q10: Marginal revenue is less than price for
Q11: If a monopolist is practising perfect price
Q12: Your food-services company has been named as
Q13: Which of the following statements about single-price