Multiple Choice
The diagram below shows the demand curve facing a single-price monopolist. 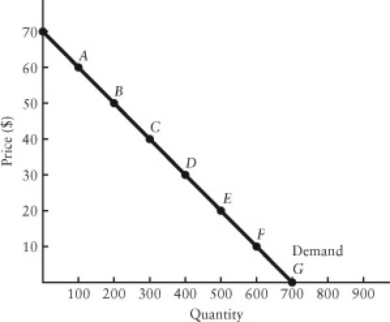 FIGURE 10-4
-Refer to Figure 10-4.Suppose the firm is currently at point C on the demand curve,selling 300 units at $40 per unit.If the firm moves to point D,the revenue the firm gives up on the units it was already selling is ________ and the revenue it gains on the additional units sold is ________.
A) $9000; $9000
B) $12 000; $12 000
C) $3000; 4000
D) $4000; $3000
E) $3000; $3000
Correct Answer:

Verified
Correct Answer:
Verified
Q79: Suppose a monopolist faces the demand curve
Q80: It is common for a cartel to
Q81: The two characteristic problems for cartels are<br>A)agreeing
Q82: The diagram below shows the demand curve
Q83: Natural barriers to firms to entering an
Q85: One reason airlines charge a higher price
Q86: If a single-price monopolist's price equals marginal
Q87: 10.3 Price Discrimination<br>Suppose a monopolist faces the
Q88: Consider the following statement: "Price discrimination is
Q89: Which one of the following cases is