Multiple Choice
The diagram below shows the demand curve facing a single-price monopolist. 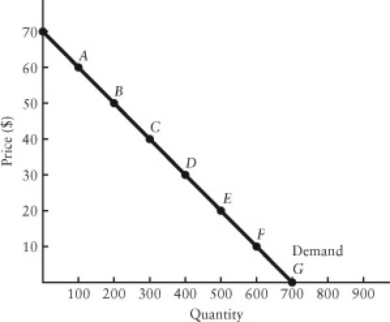 FIGURE 10-4
-Refer to Figure 10-4.What is the firm's marginal revenue per unit as it moves from point C to point D on the demand curve?
A) $0
B) $10
C) $50
D) $100
E) $3000
Correct Answer:

Verified
Correct Answer:
Verified
Related Questions
Q64: A number of firms agreeing together to
Q65: The diagram below shows total revenue for
Q66: A cartel can only succeed in the
Q67: Suppose a monopolist faces the demand curve
Q68: Consider a single-price monopolist that is operating
Q70: The diagram below shows the demand curve
Q71: Which of the following statements about a
Q72: Suppose all of the firms in a
Q73: Your food-services company has been named as
Q74: If a monopolist's marginal revenue is MR