Multiple Choice
The diagram below shows total revenue for a single-price monopolist. 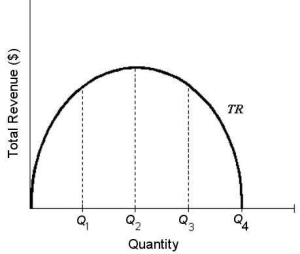 FIGURE 10-3
-Refer to Figure 10-3.The profit-maximizing output for this single-price monopolist is
A) Q1
B) Q2.
C) Q3.
D) Q4.
E) not determinable from the diagram.
Correct Answer:

Verified
Correct Answer:
Verified
Q73: Your food-services company has been named as
Q74: If a monopolist's marginal revenue is MR
Q75: A single-price monopolist is currently producing an
Q76: <img src="https://d2lvgg3v3hfg70.cloudfront.net/TB5441/.jpg" alt=" TABLE 10-1 -Refer
Q77: The diagram below shows the demand curve
Q79: Suppose a monopolist faces the demand curve
Q80: It is common for a cartel to
Q81: The two characteristic problems for cartels are<br>A)agreeing
Q82: The diagram below shows the demand curve
Q83: Natural barriers to firms to entering an