Multiple Choice
Suppose a monopolist faces the demand curve and cost curves shown below. 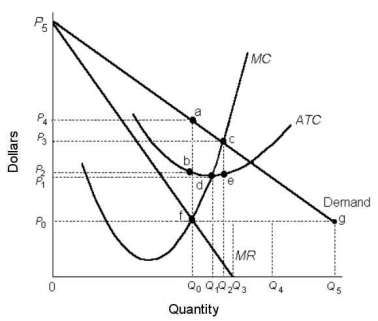 FIGURE 10-5
-Refer to Figure 10-5.If this single-price monopolist is producing at the profit-maximizing level of output,the total revenue is represented by the area
A) 0P4aQ0.
B) 0P3cQ2.
C) 0P1dQ1.
D) 0P2bQ0.
E) 0P0gQ5.
Correct Answer:

Verified
Correct Answer:
Verified
Q109: Consider the following AR and MR curves
Q110: <img src="https://d2lvgg3v3hfg70.cloudfront.net/TB5441/.jpg" alt=" TABLE 10-1 -Refer
Q111: The cartelization of an industry with a
Q112: The diagram below shows the demand curve
Q113: Consider the following AR and MR curves
Q115: For a monopolist,the profit-maximizing level of output
Q116: A single-price monopolist is currently producing an
Q117: A firm is best described as a
Q118: <img src="https://d2lvgg3v3hfg70.cloudfront.net/TB5441/.jpg" alt=" TABLE 10-1 -Refer
Q119: Suppose the technology of an industry is