Multiple Choice
The diagram below shows selected cost and revenue curves for a firm in a monopolistically competitive industry. 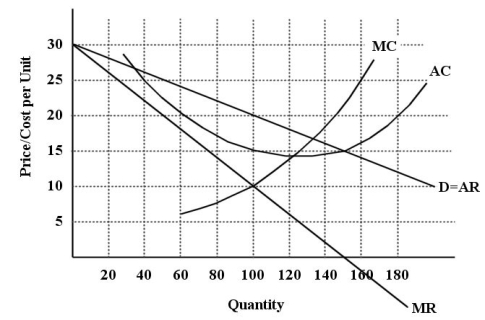 FIGURE 11-1
-Refer to Figure 11-1.Assuming that this firm is producing its profit-maximizing level of output,what are the profits or losses being earned by this firm?
A) -$500
B) -$1000
C) $2000
D) $1000
E) $500
Correct Answer:

Verified
Correct Answer:
Verified
Q1: For firms in an oligopoly,the main advantage
Q2: The presence of significant scale economies in
Q3: The payoff matrix below shows the payoffs
Q5: If joint profits are to be maximized
Q6: The diagram below shows demand and cost
Q7: When a monopolistically competitive industry is in
Q8: Suppose there are many independent dry cleaners
Q9: Which of the following industries in Canada
Q10: "Brand proliferation" is an example of<br>A)an economy
Q11: The diagram below shows selected cost and