Multiple Choice
The diagram below shows demand and cost curves for a monopolistically competitive firm. 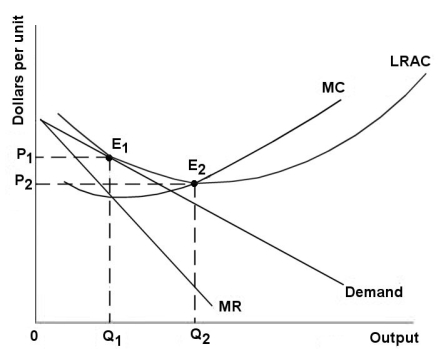 FIGURE 11-3
-Refer to Figure 11-3.In the long run,a monopolistically competitive firm will
A) produce Q2 at Price P1.
B) produce Q1 at Price P2.
C) produce Q1 at Price P1.
D) produce Q2 at Price P2.
E) produce the output where AC is at its minimum.
Correct Answer:

Verified
Correct Answer:
Verified
Q55: The payoff matrix below shows the payoffs
Q56: Which of the following are products that
Q57: <img src="https://d2lvgg3v3hfg70.cloudfront.net/TB5441/.jpg" alt=" FIGURE 11-2 -Refer
Q58: Consider the following characteristics of a particular
Q59: The diagram below shows demand and cost
Q61: One reason an oligopolistic firm may have
Q62: The diagram below shows selected cost and
Q63: An ineffective means of discouraging the entry
Q64: <img src="https://d2lvgg3v3hfg70.cloudfront.net/TB5441/.jpg" alt=" FIGURE 11-2 -Refer
Q65: Which of the following products is best