Multiple Choice
The diagram below shows demand and cost curves for a monopolistically competitive firm. 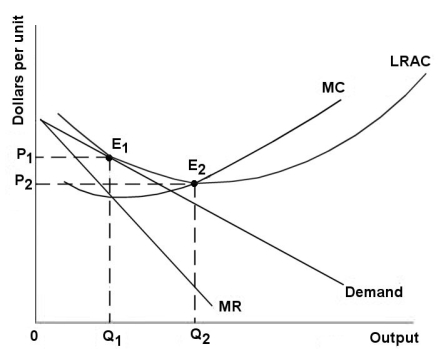 FIGURE 11-3
-Refer to Figure 11-3.A monopolistically competitive firm is allocatively inefficient because in the long-run equilibrium
A) LRAC is not at its minimum.
B) MC is greater than price.
C) price is greater than MC at Q1.
D) price is greater than LRAC at Q1.
E) None of the above - the long-run equilibrium is allocatively efficient.
Correct Answer:

Verified
Correct Answer:
Verified
Q102: If firms are able to freely enter
Q103: The payoff matrix below shows the payoffs
Q104: Assume that the world's largest smart-phone producers
Q105: One difference between a perfectly competitive market
Q106: Suppose two firms,Allstom from France,and Bombardier from
Q108: Consider the following characteristics of a particular
Q109: Which of the following characteristics is NOT
Q110: The payoff matrix below shows the payoffs
Q111: Consider an example of the prisoner's dilemma
Q112: Suppose that a monopolistically competitive firm decides