Multiple Choice
The diagram below shows selected cost and revenue curves for a firm in a monopolistically competitive industry. 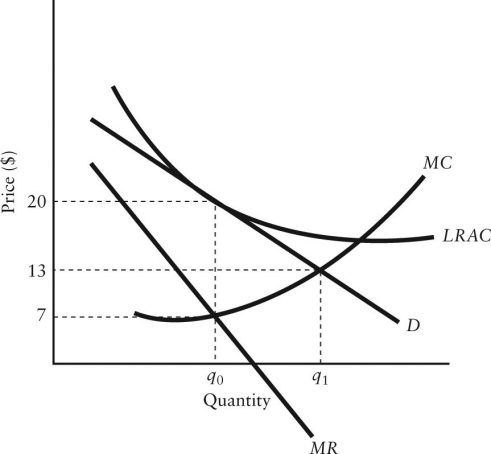 FIGURE 11-4
-Refer to Figure 11-4.Assuming this firm is producing its profit-maximizing level of output,what are the profits or losses being earned by this firm?
A) $0 per unit
B) $7 per unit
C) $13 per unit
D) $6 per unit
E) $20 per unit
Correct Answer:

Verified
Correct Answer:
Verified
Q15: Consider the following characteristics of a particular
Q16: The following statements describe a cooperative equilibrium
Q17: When a monopolistically competitive industry is in
Q18: Advertising by existing firms in an oligopolistic
Q19: What is a Nash equilibrium?<br>A)an example of
Q21: Consider an industry that is monopolistically competitive.In
Q22: Both empirical evidence and everyday observation suggest
Q23: Consider an example of the prisoner's dilemma
Q24: Consider the three largest cell-phone service providers
Q25: If there are economic profits in a