Multiple Choice
The diagram below shows selected cost and revenue curves for a firm in a monopolistically competitive industry. 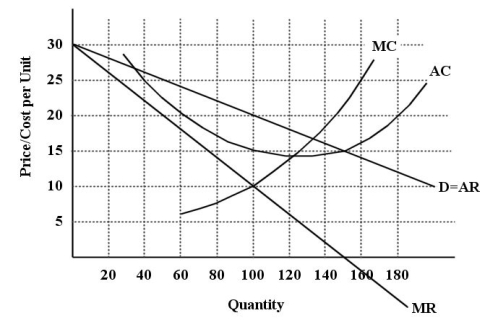 FIGURE 11-1
-Refer to Figure 11-1.If this firm is maximizing its profits,does the diagram depict a long-run equilibrium situation?
A) Yes,because this firm is producing where MC = MR and is earning zero profits.
B) Yes,because this firm is producing where MC = MR and is earning economic profits.
C) No,because this firm is earning profits which will attract new firms to this market.
D) No,because this firm is suffering losses and firms will exit this market.
E) No,because this firm is a natural monopoly.
Correct Answer:

Verified
Correct Answer:
Verified
Q42: Oligopolists make decisions after taking into account
Q43: In long-run equilibrium,a monopolistically competitive industry operates
Q44: In which market structure are price fluctuations
Q45: An example of a Canadian industry composed
Q46: Which of the following is an incorrect
Q48: Consider the following characteristics of a particular
Q49: A monopolistically competitive firm and a monopoly
Q50: If entry into a monopolistically competitive industry
Q51: Tacit collusion in an oligopolistic industry<br>A)occurs when
Q52: The diagram below shows demand and cost