Multiple Choice
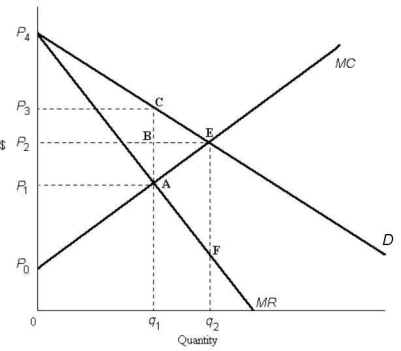 FIGURE 12-3
-Refer to Figure 12-3.The area representing consumer surplus in a monopoly equilibrium is outlined by
A) ACE.
B) ABE.
C) 0P4Eq2.
D) P3P4C.
E) P2P4E.
Correct Answer:

Verified
Correct Answer:
Verified
Q84: Consider the efficiency of various market structures.In
Q85: The diagram below shows the demand and
Q86: <img src="https://d2lvgg3v3hfg70.cloudfront.net/TB5441/.jpg" alt=" FIGURE 12-3 -Refer
Q87: Consider two firms,A and B,that are producing
Q88: The diagram below shows supply,demand,and quantity exchanged
Q90: Suppose there are only two firms (Firms
Q91: Which of the following is the definition
Q92: The production possibilities boundary shows possible combinations
Q93: Consider two firms,A and B,that are producing
Q94: <img src="https://d2lvgg3v3hfg70.cloudfront.net/TB5441/.jpg" alt=" FIGURE 12-3 -Refer