Multiple Choice
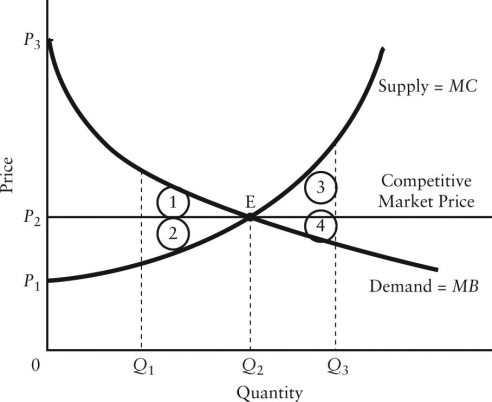
The diagram below shows the demand and supply curves in a perfectly competitive market.  FIGURE 12-5
-Refer to Figure 12-5.If output in this market were Q1,the total loss in economic surplus relative to the competitive equilibrium would be illustrated by area
A) P1P3E.
B) 1.
C) 2.
D) 1 + 2.
E) 1 + 2 + 3 + 4.
Correct Answer:

Verified
Correct Answer:
Verified
Q76: For an entire economy,allocative efficiency requires that<br>A)goods
Q77: An economy will be allocatively efficient if<br>A)least-cost
Q78: The diagram below shows the demand and
Q79: According to economist George Stigler,the process of
Q80: Prior to the 1986 amendments to the
Q82: When comparing a perfectly competitive firm and
Q83: In Canada,a significant challenge for the Competition
Q84: Consider the efficiency of various market structures.In
Q85: The diagram below shows the demand and
Q86: <img src="https://d2lvgg3v3hfg70.cloudfront.net/TB5441/.jpg" alt=" FIGURE 12-3 -Refer