Multiple Choice
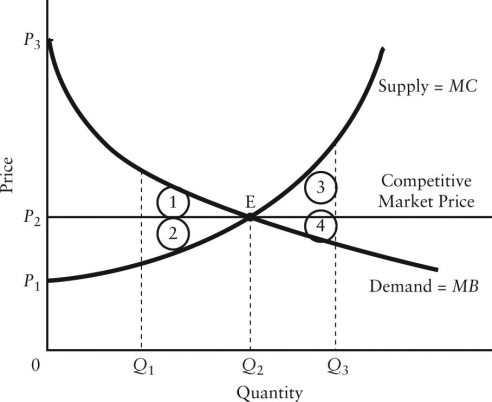
The diagram below shows the demand and supply curves in a perfectly competitive market.  FIGURE 12-5
-Refer to Figure 12-5.If output in this market were Q3,and the price was still equal to its free-market level,the loss in producer surplus relative to the competitive equilibrium would be illustrated by area
A) 1.
B) 2.
C) 3.
D) 4.
E) 3 + 4.
Correct Answer:

Verified
Correct Answer:
Verified
Q51: The deadweight loss of monopoly is<br>A)its fixed
Q52: Which of the following is an example
Q53: We can safely say that each point
Q54: The diagram below shows cost and revenue
Q55: Productive efficiency for an individual firm requires
Q57: Consider three firms,A,B and C,all producing kilos
Q58: In the long run,the imposition of average-cost
Q59: The diagram below shows supply,demand,and quantity exchanged
Q60: If a regulatory agency imposes a lump-sum
Q61: Consider the following information for a regional