Multiple Choice
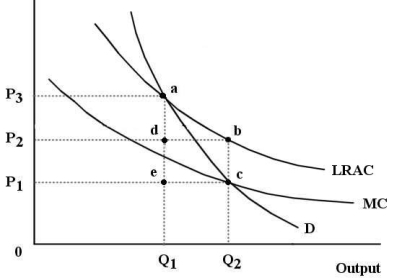
The diagram below shows the market demand curve and the cost curves for a single firm.  FIGURE 12-6
-Refer to Figure 12-6.Suppose this firm is being regulated using a policy of average-cost pricing.In this case,
A) the result is allocatively efficient because economic profits are zero.
B) the result is allocatively inefficient because price exceeds marginal cost.
C) the level of output is too low,but the price is allocatively efficient.
D) the result is as close to the competitive outcome as possible.
E) the result is allocatively inefficient because the marginal cost curve is downward sloping.
Correct Answer:

Verified
Correct Answer:
Verified
Q67: Which of the following is the result
Q68: Consider the case of a natural monopoly
Q69: The diagram below shows supply,demand,and quantity exchanged
Q70: Consider a public utility that is a
Q71: The diagram below shows the market demand
Q73: The diagram below shows cost and revenue
Q74: If all firms are profit maximizers,then the
Q75: If the total output of some industry
Q76: For an entire economy,allocative efficiency requires that<br>A)goods
Q77: An economy will be allocatively efficient if<br>A)least-cost