Multiple Choice
The diagram below shows the MRP curve for a firm producing copper plumbing pipe.The factor of production being considered here is hours of labour. 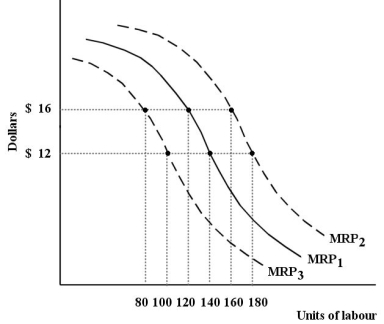 FIGURE 13-1
-Refer to Figure 13-1.This firm's MRP curve is the firm's
A) derived demand for copper plumbing pipe.
B) demand curve for labour.
C) market demand curve for copper plumbing pipe.
D) marginal product of labour curve.
E) total product curve for labour.
Correct Answer:

Verified
Correct Answer:
Verified
Q1: Consider the following demand and supply curves
Q3: Suppose that the municipal government of Calgary
Q4: Consider the following production and cost schedule
Q5: Consider the following demand and supply curves
Q6: Which of the following statements concerning factor
Q7: The table below shows the total production
Q8: Suppose the government decides,in the interest of
Q9: Consider the following production and cost schedule
Q10: Consider the following production and cost schedule
Q11: Kobe Bryant is a highly paid professional