Multiple Choice
The diagram below shows the MRP curve for a firm producing copper plumbing pipe.The factor of production being considered here is hours of labour. 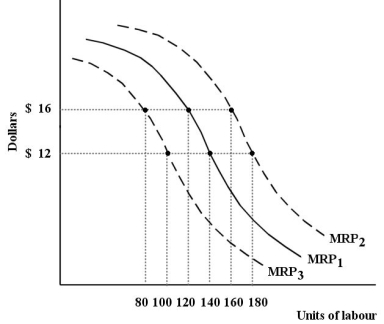 FIGURE 13-1
-Refer to Figure 13-1.Suppose this firm initially has the marginal revenue product curve MRP1.One reason that the curve could shift to MRP3 is
A) an increase in demand for the firm's output,copper plumbing pipe.
B) a decrease in the market price of copper plumbing pipe.
C) a decrease in the supply of labour.
D) an increase in the wage rate.
E) an increase in the marginal product of labour.
Correct Answer:

Verified
Correct Answer:
Verified
Q38: The three diagrams below each show a
Q39: Consider a firm's demand curve for labour.If
Q40: The diagram below shows the MRP curve
Q41: Which of the following is the best
Q42: If at a particular wage rate in
Q44: Alfred Marshall's concept of "transfer earnings" denotes<br>A)the
Q45: Consider labour hired for $18 per hour.If
Q46: Consider a small firm that is producing
Q47: The table below shows the total production
Q48: Consider labour that is hired for $18