Multiple Choice
The diagram below shows the MRP curve for a firm producing copper plumbing pipe.The factor of production being considered here is hours of labour. 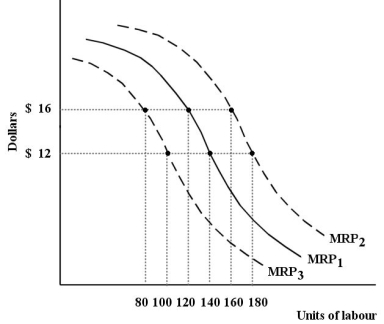 FIGURE 13-1
-Refer to Figure 13-1.Suppose this firm has the marginal revenue product curve MRP1.At a wage rate of $12,the profit-maximizing firm will hire ________ units of labour.
A) 100
B) 120
C) 140
D) 160
E) 180
Correct Answer:

Verified
Correct Answer:
Verified
Q111: Consider a small firm that is producing
Q112: Consider the following production and cost schedule
Q113: If small changes in incentives can induce
Q114: The hypothesis of equal net advantage explains
Q115: When the wage paid to workers in
Q117: The demand and supply curves shown below
Q118: The demand and supply curves shown below
Q119: Consider a firm's demand curve for labour.If
Q120: The demand curve for a variable factor
Q121: Consider the mobility of any factor of