Multiple Choice
The diagram below shows the MRP curve for a firm producing copper plumbing pipe.The factor of production being considered here is hours of labour. 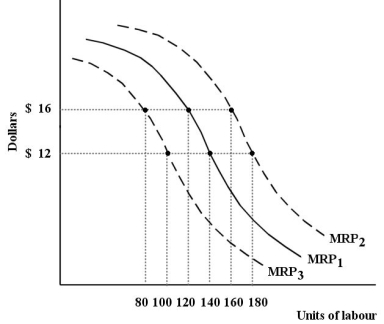 FIGURE 13-1
-Refer to Figure 13-1.Suppose this firm is facing MRP1,a wage rate of $12 per hour and is employing 150 units of labour.At this level of employment,
A) the last unit of labour is adding less to the firm's cost than it is adding to the firm's revenue,so it should increase the use of labour.
B) the last unit of labour contributes as much to the firm's costs as to the firm's revenues and so the firm should not change its use of labour.
C) the last unit of labour is adding more to the firm's cost than it is adding to the firm's revenue,so it should reduce the use of labour.
D) the firm has shifted the MRP curve to MRP2.
E) the firm has shifted the MRP curve to MRP3.
Correct Answer:

Verified
Correct Answer:
Verified
Q21: Consider the following table for a firm.The
Q22: Consider the following production and cost schedule
Q23: Which of the following is the best
Q24: If the supply curve for a factor
Q25: The table below shows the total production
Q27: In a perfectly competitive labour market,a profit-maximizing
Q28: Which of the following statements about equilibrium
Q29: Consider the following production and cost schedule
Q30: The term "economic rent" refers to<br>A)a payment
Q31: Suppose the last unit of a factor