Multiple Choice
The three diagrams below each show a supply curve for oil tankers over a relatively short period of time. 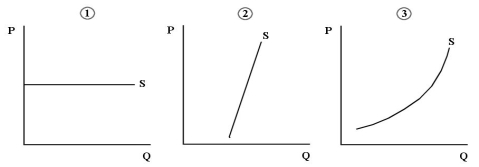 FIGURE 13-3
-Refer to Figure 13-3.Consider oil tankers as a factor of production (for example,for the production of gasoline) .Which diagram shows the most mobility of this factor of production?
A) diagram 1
B) diagram 2
C) diagram 3
D) none of the diagrams
E) each diagram shows mobility
Correct Answer:

Verified
Correct Answer:
Verified
Q11: Kobe Bryant is a highly paid professional
Q12: Consider a small firm that is producing
Q13: Other things equal,if a particular province has
Q14: Consider the following production and cost schedule
Q15: Suppose a cook at a diamond mining
Q17: The table below shows the total production
Q18: Consider the following demand and supply curves
Q19: Consider the following table for a firm.The
Q20: Which of the following would be least
Q21: Consider the following table for a firm.The