Multiple Choice
The demand and supply curves shown below apply to a competitive market for a factor used in the production of widgets. 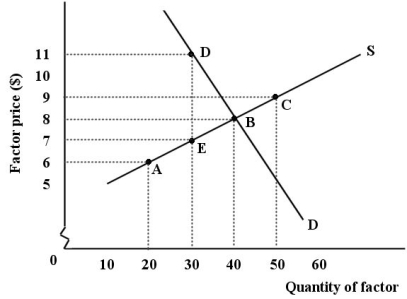 FIGURE 13-2
-Refer to Figure 13-2.This factor market is initially in equilibrium at point B,but changes occur that cause the equilibrium to shift to point D (S curve shifts left) .At the new equilibrium,total factor earnings ________ compared to the initial equilibrium.
A) decreased by $30
B) increased by $30
C) remained the same
D) increased by $10
E) increased by $330
Correct Answer:

Verified
Correct Answer:
Verified
Q59: Consider the following table for a firm.The
Q60: Consider the following production and cost schedule
Q61: Consider a firm's demand for a factor
Q62: Consider labour that is hired for $18
Q63: Consider the following production and cost schedule
Q65: The demand for a factor will be
Q66: Consider a manufacturing plant as an example
Q67: Consider labour that is hired for $18
Q68: Which of the following is the best
Q69: The diagram below shows the MRP curve