Multiple Choice
The table below shows the payments at the end of each year from three different physical assets.
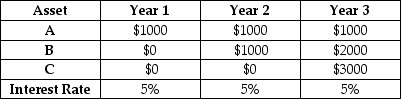 TABLE 15-1
-Refer to Table 15-1.A,B,and C represent possible purchases of physical capital,each offering a stream of payments as indicated in the table.There are no payments beyond Year 3.The interest rates in each year are also specified in the table.What is the present value (at the beginning of Year 1) of asset B?
A) $3000
B) $3150
C) $2634.70
D) $2590.67
E) $2722.97
Correct Answer:

Verified
Correct Answer:
Verified
Q7: The economy's supply curve for saving (financial
Q8: A decrease in market interest rates will<br>A)increase
Q9: The diagram below shows a firm's demand
Q10: To determine an individual profit-maximizing firm's maximum
Q11: Carol can borrow $13 000 to buy
Q13: Consider the economy's downward-sloping demand for investment
Q14: For the economy as a whole,the equilibrium
Q15: We can think about the interest rate
Q16: The Canadian government introduced the Tax-Free Savings
Q17: Consider a manufacturing firm that contemplates buying