Multiple Choice
The diagram below shows a firm's demand for its units of capital-coin-operated coffee machines.The firm places its machines in universities and colleges across Canada. 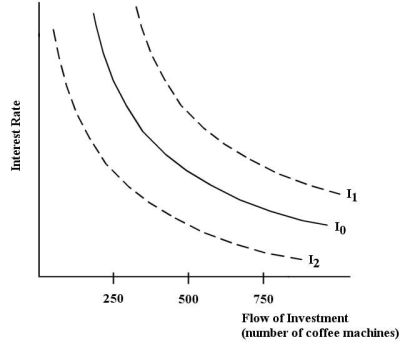 FIGURE 15-1
-Refer to Figure 15-1.One possible explanation for a shift of the firm's investment demand curve from I0 to I2 is
A) an increase in the interest rate.
B) a technological improvement that reduces the cost per cup of coffee.
C) a decrease in the interest rate.
D) an increase in the expected MRP of the coffee machines.
E) demographic changes that lead to a reduction in the growth rate of the student population at universities.
Correct Answer:

Verified
Correct Answer:
Verified
Q34: <img src="https://d2lvgg3v3hfg70.cloudfront.net/TB5441/.jpg" alt=" FIGURE 15-2 -Refer
Q35: How much would you have to deposit
Q36: Consider the flow of investment and saving
Q37: Under which of the following circumstances will
Q38: An economy's upward-sloping supply curve of desired
Q40: Choose the best reason for a rightward
Q41: When a firm is making a decision
Q42: Suppose that you lend me $100 for
Q43: <img src="https://d2lvgg3v3hfg70.cloudfront.net/TB5441/.jpg" alt=" FIGURE 15-2 -Refer
Q44: The firm in the table below produces