Multiple Choice
The diagram below shows demand and supply curves for some perfectly competitive market. 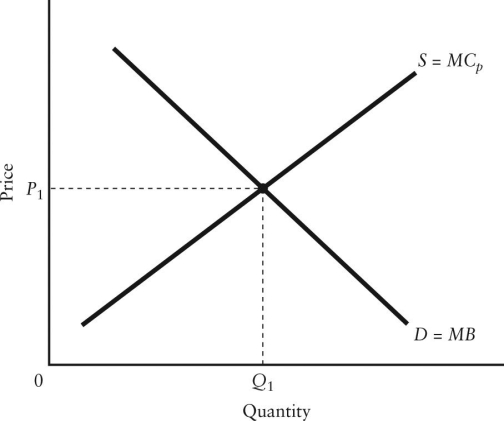 FIGURE 16-2
-Refer to Figure 16-2.Suppose that the marginal benefit curve (MB) includes all social benefits and that there is a positive externality in production.In this case,________ for allocative efficiency.
A) P1 and Q1 are appropriate
B) the price P1 is appropriate but the quantity Q1 is too low
C) the price P1 is appropriate but the quantity Q1 is too high
D) the price P1 is too low and the quantity Q1 is too high
E) the price P1 is too high and the quantity Q1 is too low
Correct Answer:

Verified
Correct Answer:
Verified
Q113: In economics,the term "public good" refers to
Q114: How might a government intervene in a
Q115: Consider a remote village with a limited,freely
Q116: The main point about public choice theory
Q117: Government intervention in an effort to promote
Q119: Economists use the term "market failure" to
Q120: If a firm produces a good and
Q121: Economists generally agree that government intervention in
Q122: An example of a rivalrous good is<br>A)toxic
Q123: Provincial laws that mandate a minimum drinking