Multiple Choice
The diagram below shows the marginal benefit and marginal cost of a public good.This economy has 3 individuals,A,B and C.The diagram shows the MB for each individual and a summation of their marginal benefits. 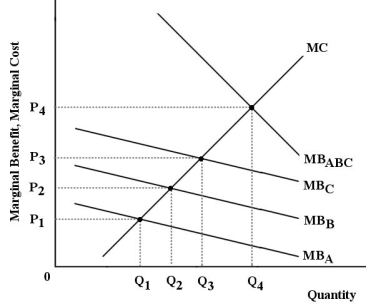 FIGURE 16-4
-Refer to Figure 16-4.What is the optimal quantity of this public good to provide?
A) Q
B) Q1
C) Q2
D) Q3
E) Q4
Correct Answer:

Verified
Correct Answer:
Verified
Q82: Governments usually provide a system of unemployment
Q83: <img src="https://d2lvgg3v3hfg70.cloudfront.net/TB5441/.jpg" alt=" FIGURE 16-1 -Refer
Q84: Consider an industry producing good X.The quantity
Q85: The existence of imperfectly competitive firms implies
Q86: An example of a public good is<br>A)apples
Q88: The diagram below shows the supply and
Q89: Economists consider a product such as a
Q90: Economists describe prices as "signals" in a
Q91: The essential coordinating mechanism of a free-market
Q92: If typical firms in a competitive industry