Multiple Choice
The diagram below shows the marginal benefit and marginal cost of a public good.This economy has 3 individuals,A,B and C.The diagram shows the MB for each individual and a summation of their marginal benefits. 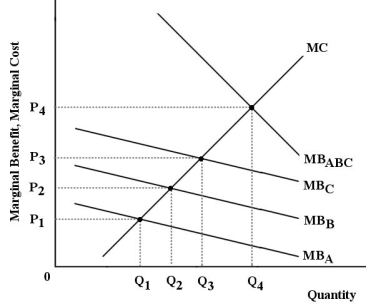 FIGURE 16-4
-Refer to Figure 16-4.Suppose the government provides Q4 units of the public good.If the government was able to require consumers to pay a price of P4,then
A) the market would clear,although not enough would be produced.
B) the inefficient quantity would be being produced.
C) the appropriate price would be achieved,although not enough would be consumed.
D) consumers would not use the public good at all,and this would be socially optimal.
E) consumers would use too little of the public good,and this would be inefficient for society.
Correct Answer:

Verified
Correct Answer:
Verified
Q107: Which of the following statements about public
Q108: Which of the following is the best
Q109: Consider an ordinary rivalrous good,provided in a
Q110: The price charged for access to an
Q111: The "formal defence" of free markets includes
Q113: In economics,the term "public good" refers to
Q114: How might a government intervene in a
Q115: Consider a remote village with a limited,freely
Q116: The main point about public choice theory
Q117: Government intervention in an effort to promote