Multiple Choice
The diagram below shows the marginal benefit and marginal cost of a public good.This economy has 3 individuals,A,B and C.The diagram shows the MB for each individual and a summation of their marginal benefits. 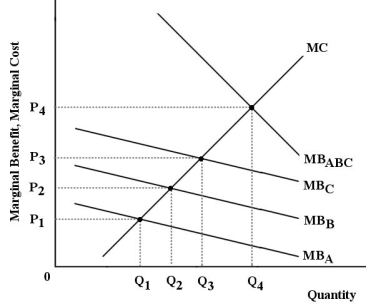 FIGURE 16-4
-Refer to Figure 16-4.Suppose the government provides Q4 units of the public good.If consumers were then required to pay a price of zero for the good,
A) the market would clear,although not enough would be produced.
B) the inefficient quantity would be being produced.
C) consumers would use too little of the public good,and the outcome would be inefficient for society.
D) consumers would use the public good until their marginal benefit was zero,and this would be socially optimal.
E) the appropriate price would be achieved,although not enough would be consumed.
Correct Answer:

Verified
Correct Answer:
Verified
Q89: Economists consider a product such as a
Q90: Economists describe prices as "signals" in a
Q91: The essential coordinating mechanism of a free-market
Q92: If typical firms in a competitive industry
Q93: Which of the following statements concerning cost-benefit
Q95: Services such as those within the justice
Q96: Private markets will always provide too few
Q97: One reason that national defence is a
Q98: A homeowner decides to buy three large
Q99: In a competitive market economy with no