Multiple Choice
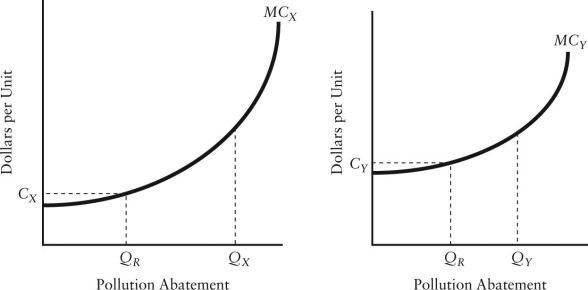
The diagram below shows the marginal cost of pollution abatement for two firms,Firm X and Firm Y.  FIGURE 17-4
-Refer to Figure 17-4.Suppose the government requires each firm to reduce pollution by the same amount,QR.The result will be
A) fair and just because both firms are facing the same requirements.
B) economically inefficient because Firm X is not producing as much pollution as Firm Y and therefore should not be faced with the same requirements.
C) economically efficient because even though their marginal costs of abatement differ,the marginal cost for the last unit of abatement is equal.
D) economically inefficient because Firm Y is then abating pollution at a higher marginal cost than Firm X.
E) economically efficient because the maximum amount of pollution will be abated.
Correct Answer:

Verified
Correct Answer:
Verified
Q16: Suppose a firm producing roof shingles imposes
Q17: Economists often argue that a system of
Q18: A paper mill discharges chemicals into a
Q19: When designing a policy to reduce polluting
Q20: Suppose the government imposes a tax for
Q22: The table below shows the marginal costs
Q23: The table below shows the marginal costs
Q24: The optimal amount of pollution abatement is
Q25: The diagram below shows a market for
Q26: The figure below shows the demand and