Multiple Choice
The diagram below shows the marginal cost of pollution abatement for two firms,Firm X and Firm Y. 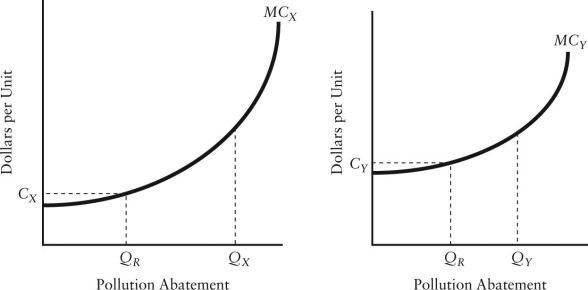 FIGURE 17-4
-Refer to Figure 17-4.The optimal amount of pollution abatement for these two firms together is
A) QR for X + QR for Y.
B) QR for X + Qy for Y.
C) Qx for X + QR for Y.
D) Qx + Qy.
E) impossible to tell without the marginal benefit of abatement curve.
Correct Answer:

Verified
Correct Answer:
Verified
Q91: Direct pollution controls can be inefficient because,for
Q92: The diagram below shows the marginal costs
Q93: Zero pollution is almost surely NOT a
Q94: When firms in an industry have fully
Q95: Suppose a firm producing roof shingles imposes
Q97: The diagram below shows the marginal cost
Q98: A paper mill discharges chemicals into a
Q99: Consider a coal-fired electric-power plant that is
Q100: When designing a policy to reduce polluting
Q101: A downward-sloping marginal benefit curve for pollution