Multiple Choice
The diagram below shows the marginal costs of pollution abatement for two firms,Firm 1 and Firm 2. 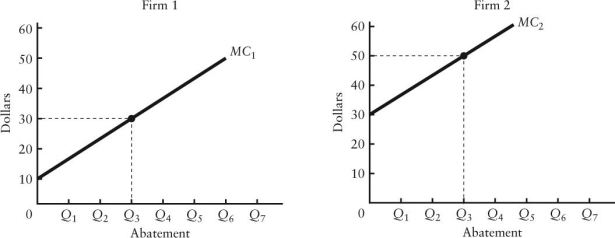 FIGURE 17-5
-Refer to Figure 17-5.Suppose the government requires that each firm abate pollution to the level Q3.The outcome would be efficient because
A) the marginal costs of abatement are equated for the two firms.
B) the maximum amount of pollution is being abated at the lowest cost.
C) the marginal cost and marginal benefit of pollution abatement are equated.
D) all of the above.
E) none of the above; the outcome would be inefficient.
Correct Answer:

Verified
Correct Answer:
Verified
Q68: The marginal benefit of reducing pollution in
Q69: Consider the following equation: GHG = <img
Q70: Two firms,A and B,are legally required to
Q71: Automobile emissions standards are an example of<br>A)direct
Q72: Given that different firms typically have different
Q74: If pollution is associated with the production
Q75: Private and competitive markets could produce efficient
Q76: The table below shows the marginal benefit
Q77: Suppose a competitive market for tradable pollution
Q78: Why are direct controls for reducing pollution