Multiple Choice
The diagram below shows the marginal cost of pollution abatement for two firms,Firm X and Firm Y. 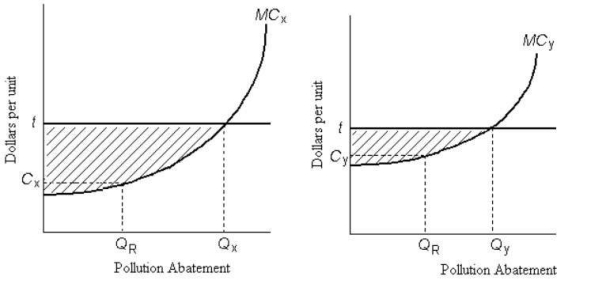 FIGURE 17-6
-Refer to Figure 17-6.Ignore the horizontal line at t.If the government wanted to impose an emissions tax,efficiency requires that it
A) levy a tax at the same rate to both firms.
B) choose a different tax rate for each firm so that each firm abates QR units of pollution.
C) impose the same tax on both firms and also fix the amount of pollution abatement at QR for each firm.
D) tax only the high-cost firm (Firm Y) and fix the amount of pollution abatement for the low-cost firm (Firm X) .
E) tax only the low-cost firm (Firm X) and fix the amount of pollution abatement for the high-cost firm (Firm Y) .
Correct Answer:

Verified
Correct Answer:
Verified
Q98: A paper mill discharges chemicals into a
Q99: Consider a coal-fired electric-power plant that is
Q100: When designing a policy to reduce polluting
Q101: A downward-sloping marginal benefit curve for pollution
Q102: A pollution-control policy that,in principle,can perfectly internalize
Q104: The diagram below shows the private and
Q105: Economists generally view pollution as<br>A)an economic "bad"
Q106: Suppose a farm that is polluting an
Q107: Consider the following equation: GHG = <img
Q108: The table below shows the marginal benefit