Multiple Choice
The diagram below shows the marginal cost of pollution abatement for two firms,Firm X and Firm Y. 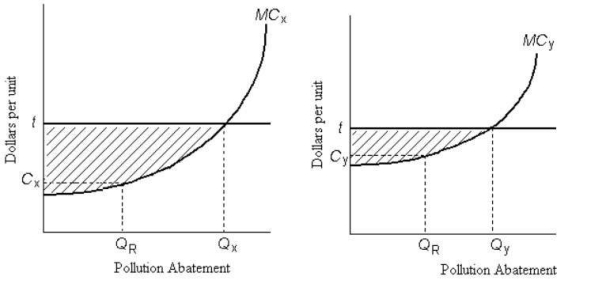 FIGURE 17-6
-Refer to Figure 17-6.Firms X and Y have an emissions tax of $t imposed on each unit of pollution they produce.If Firm X chooses to abate QX units of pollution,the total cost of its abatement is
A) tax amount t multiplied by the maximum possible level of pollution abatement.
B) area beneath the marginal cost of pollution abatement curve.
C) area below the horizontal line at t and above the MC of pollution abatement curve.
D) tax amount t multiplied by the level of pollution abatement,QX.
E) area beneath the marginal cost of pollution abatement curve up to QX.
Correct Answer:

Verified
Correct Answer:
Verified
Q33: Suppose a local meat packing company dumps
Q34: Global greenhouse-gas (GHG)emission reductions are unlikely to
Q35: An upward-sloping marginal cost curve for pollution
Q36: The figure below shows the marginal benefit
Q37: The figure below shows the demand and
Q39: A policy that puts a price on
Q40: The table below shows the marginal costs
Q41: Suppose a farm that is polluting an
Q42: The diagram below shows a market for
Q43: The marginal benefit of reducing pollution and