Multiple Choice
The diagram below shows the marginal cost of pollution abatement for two firms,Firm X and Firm Y. 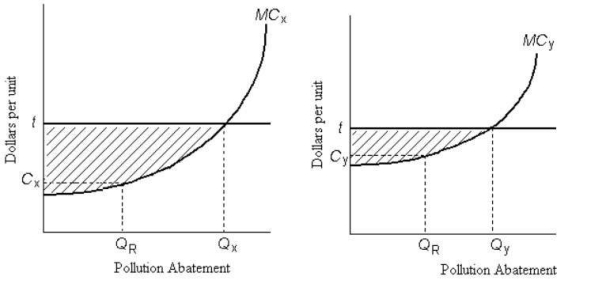 FIGURE 17-6
-Refer to Figure 17-6.There is an emissions tax of $t per unit of pollution.Which of the following statements regarding the pollution abatement activities by the two firms is correct?
A) It is not socially optimal to have Firm X doing pollution abatement of QX while Firm Y does the lesser amount,QY.
B) It is efficient for Firm Y to do less pollution abatement than Firm X because Firm Y faces higher costs of abatement.
C) The emissions tax causes no change in the firms' polluting activity.
D) The shaded areas in the two graphs depict the social costs of pollution caused by Firms X and Y.
E) The emissions tax causes an optimal level of pollution.
Correct Answer:

Verified
Correct Answer:
Verified
Q39: A policy that puts a price on
Q40: The table below shows the marginal costs
Q41: Suppose a farm that is polluting an
Q42: The diagram below shows a market for
Q43: The marginal benefit of reducing pollution and
Q45: Consider a coal-fired electric-power plant that is
Q46: The diagram below shows the marginal costs
Q47: The diagram below shows the marginal cost
Q48: The diagram below shows a market for
Q49: The marginal benefit of reducing pollution and