Multiple Choice
The diagram below shows supply and demand diagrams (S and D) for some product.The government then imposes an excise tax.The new supply curve is  .
. 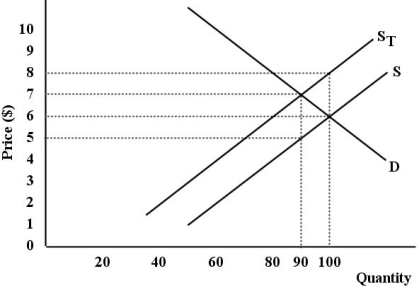 FIGURE 18-4
-Refer to Figure 18-4.What is the dollar value of the excess burden of this tax?
A) $1
B) $2
C) $5
D) $10
E) $40
Correct Answer:

Verified
Correct Answer:
Verified
Q103: Suppose a Canadian Member of Parliament suggests
Q104: According to Statistics Canada's definition,the percentage of
Q105: An efficiency argument for public provision of
Q106: <img src="https://d2lvgg3v3hfg70.cloudfront.net/TB5441/.jpg" alt=" FIGURE 18-3 -Refer
Q107: An example of a regressive tax in
Q109: Consider a monopolist that is earning profits
Q110: If one was concerned only with satisfying
Q111: Registered Retirement Savings Plans (RRSPs)operate whereby<br>A)Canadians contribute
Q112: The Canada (and Quebec)Pension Plans (CPP and
Q113: The table below shows 2015 federal income-tax