Multiple Choice
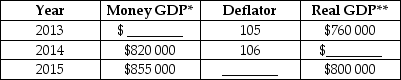
The table below shows total output for an economy over 3 years.
 * millions of dollars
** real GDP measured in millions of 2007 dollars
TABLE 20-7
-Refer to Table 20-7.The growth rate of nominal output from 2013 to 2014 is
A) 2.76%.
B) 3.36%.
C) 4.09%.
D) 4.27%.
E) 5.00%.
Correct Answer:

Verified
Correct Answer:
Verified
Q2: Suppose a Canadian firm imports $5000 worth
Q47: <img src="https://d2lvgg3v3hfg70.cloudfront.net/TB5441/.jpg" alt=" FIGURE 20-1 -Refer
Q48: The total investment that occurs in the
Q49: Consider the circular flow of expenditure and
Q52: The table below includes data for a
Q53: Suppose that in 2015,Canada Cars Corporation produced
Q55: The table below includes data for a
Q62: An example of an item that would
Q81: Using GDP as a measure of the
Q96: Which of the following is included in