Multiple Choice
The diagrams below show the import,export,and net export functions for an economy. 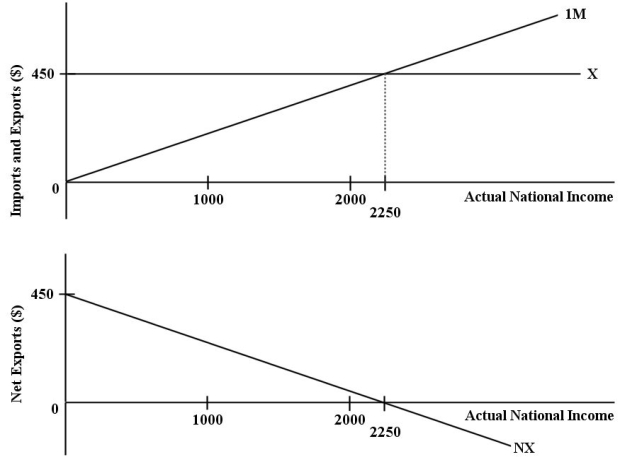 FIGURE 22-1
-Refer to Figure 22-1.If actual national income is equal to $2000,then imports are equal to
A) $0.
B) $200.
C) $400.
D) $450.
E) $1000.
Correct Answer:

Verified
Correct Answer:
Verified
Q46: Why are government expenditures such as Old
Q60: Consider the government's budget balance.Suppose G =
Q77: Consider a simple macro model with a
Q115: <img src="https://d2lvgg3v3hfg70.cloudfront.net/TB5441/.jpg" alt=" FIGURE 22-4 -Refer
Q116: The diagram below shows desired aggregate expenditure
Q118: <img src="https://d2lvgg3v3hfg70.cloudfront.net/TB5441/.jpg" alt=" FIGURE 22-5 -Refer
Q120: <img src="https://d2lvgg3v3hfg70.cloudfront.net/TB5441/.jpg" alt=" FIGURE 22-5 -Refer
Q120: A decrease in the value of the
Q125: A movement along the net export (NX)function
Q126: Consider the following news headline: "Canadians develop