Multiple Choice
The diagram below shows desired aggregate expenditure for a hypothetical economy.Assume the following features of this economy:
∙ marginal propensity to consume (mpc) = 0.75
∙ net tax rate (t) = 0.20
∙ no foreign trade
∙ fixed price level
∙ all expenditure and income figures are in billions of dollars. 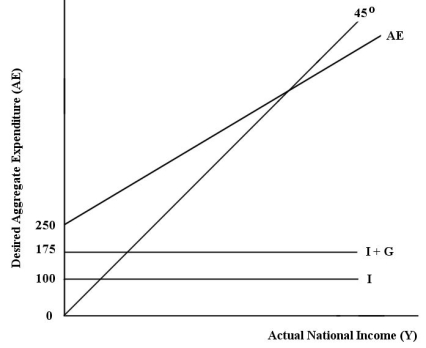 FIGURE 22-2
-Refer to Figure 22-2.Which of the following correctly describes the consumption function for this economy?
A) C = (0.6) YD
B) Y = 250 + (0.75) YD
C) C = 75 + (0.75) YD
D) Y = 250 + (0.75) Y
E) C = 250 + (0.6) Y
Correct Answer:

Verified
Correct Answer:
Verified
Q29: Consider a simple macro model with a
Q50: Consider a simple macro model with a
Q63: A rise in domestic prices relative to
Q70: Transfer payments made by the government affect
Q84: Consider a simple macro model with demand-determined
Q101: Suppose Y = 400 and the government's
Q102: <img src="https://d2lvgg3v3hfg70.cloudfront.net/TB5441/.jpg" alt=" FIGURE 22-5 -Refer
Q107: The diagram below shows desired aggregate expenditure
Q110: The simple macro model that is considered
Q116: Consider a simple macro model with a