Multiple Choice
The diagram below shows desired aggregate expenditure for a hypothetical economy.Assume the following features of this economy:
∙ marginal propensity to consume (mpc) = 0.80
∙ net tax rate (t) = 0.15
∙ no foreign trade
∙ fixed price level
∙ all expenditure and income figures are in billions of dollars. 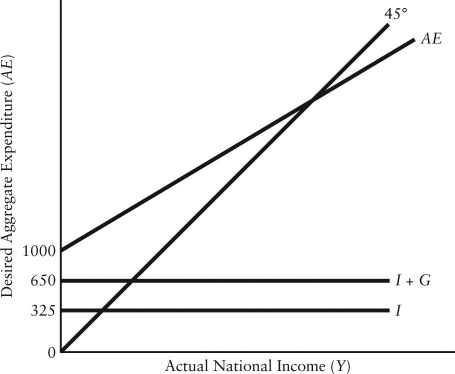 FIGURE 22-3
-Refer to Figure 22-3.What is total autonomous expenditure?
A) $300
B) $325
C) $650
D) $1000
E) $1975
Correct Answer:

Verified
Correct Answer:
Verified
Q1: Consider the following news headline: "Business community
Q14: Consider a simple macro model with a
Q16: <img src="https://d2lvgg3v3hfg70.cloudfront.net/TB5441/.jpg" alt=" FIGURE 22-4 -Refer
Q18: Suppose that the marginal propensity to consume
Q21: The table below shows national income and
Q22: The table below shows national income and
Q22: Consider the simplest macro model with demand-determined
Q99: If the price level is taken as
Q111: Consider a simple macro model with a
Q119: Consider a consumption function in a simple