Multiple Choice
The diagram below shows desired aggregate expenditure for a hypothetical economy.Assume the following features of this economy:
∙ marginal propensity to consume (mpc) = 0.80
∙ net tax rate (t) = 0.15
∙ no foreign trade
∙ fixed price level
∙ all expenditure and income figures are in billions of dollars. 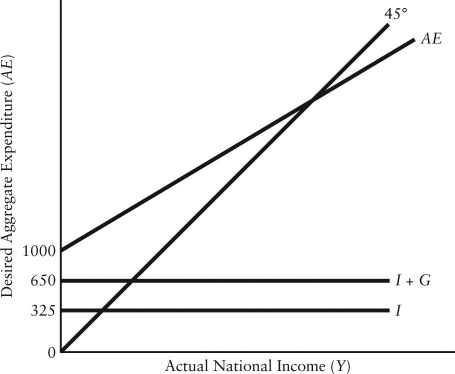 FIGURE 22-3
-Refer to Figure 22-3.Which of the following equations describes the aggregate expenditure function for this economy?
A) AE = 1000 + (0.68) Y
B) AE = 1000 + (0.80) 
C) AE = 1000 +(0.80) Y + 0.15 YD
D) AE = 1975 + (0.68) Y
E) AE = 1975 +(0.65) Y
Correct Answer:

Verified
Correct Answer:
Verified
Q1: The diagram below shows desired aggregate expenditure
Q2: <img src="https://d2lvgg3v3hfg70.cloudfront.net/TB5441/.jpg" alt=" FIGURE 22-4 -Refer
Q3: A decrease in domestic national income will
Q5: In the simple macro model that is
Q10: Suppose exports are $1850 and imports are
Q65: Consider a simple macro model with a
Q68: Suppose aggregate output is demand determined.If the
Q102: Consider the government's budget balance.Suppose G =
Q106: Consider the simplest macro model with a
Q109: Consider the government's budget balance.Suppose G =